Prescription Insights & Market
Intelligence Platform

Prescription Insights & Market Intelligence Platform

Infer actionable insights from prescription data

Schedule a demo
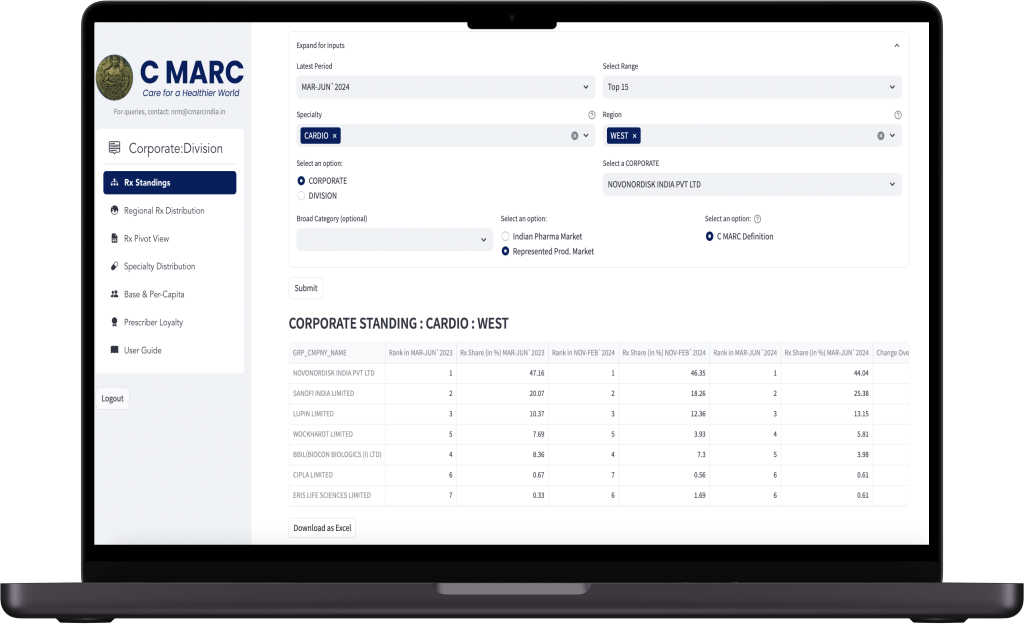
Rx MarketIQ product display in MacbookPro
Galderma logo NovoNordisk logo Novartis logo Sanofi logo Torrent logo Lupin logo J&J logo AstraZeneca logo FDC Intas Emcure LaRenon DRL Abbott GSK Glenmark

Define or choose relevant metrics
to evaluate Rx performance

Define or choose relevant metrics to evaluate Rx performance

Select from a wide range of parameters to generate therapy category, molecule, brand or corporate prescription share standings and trends.

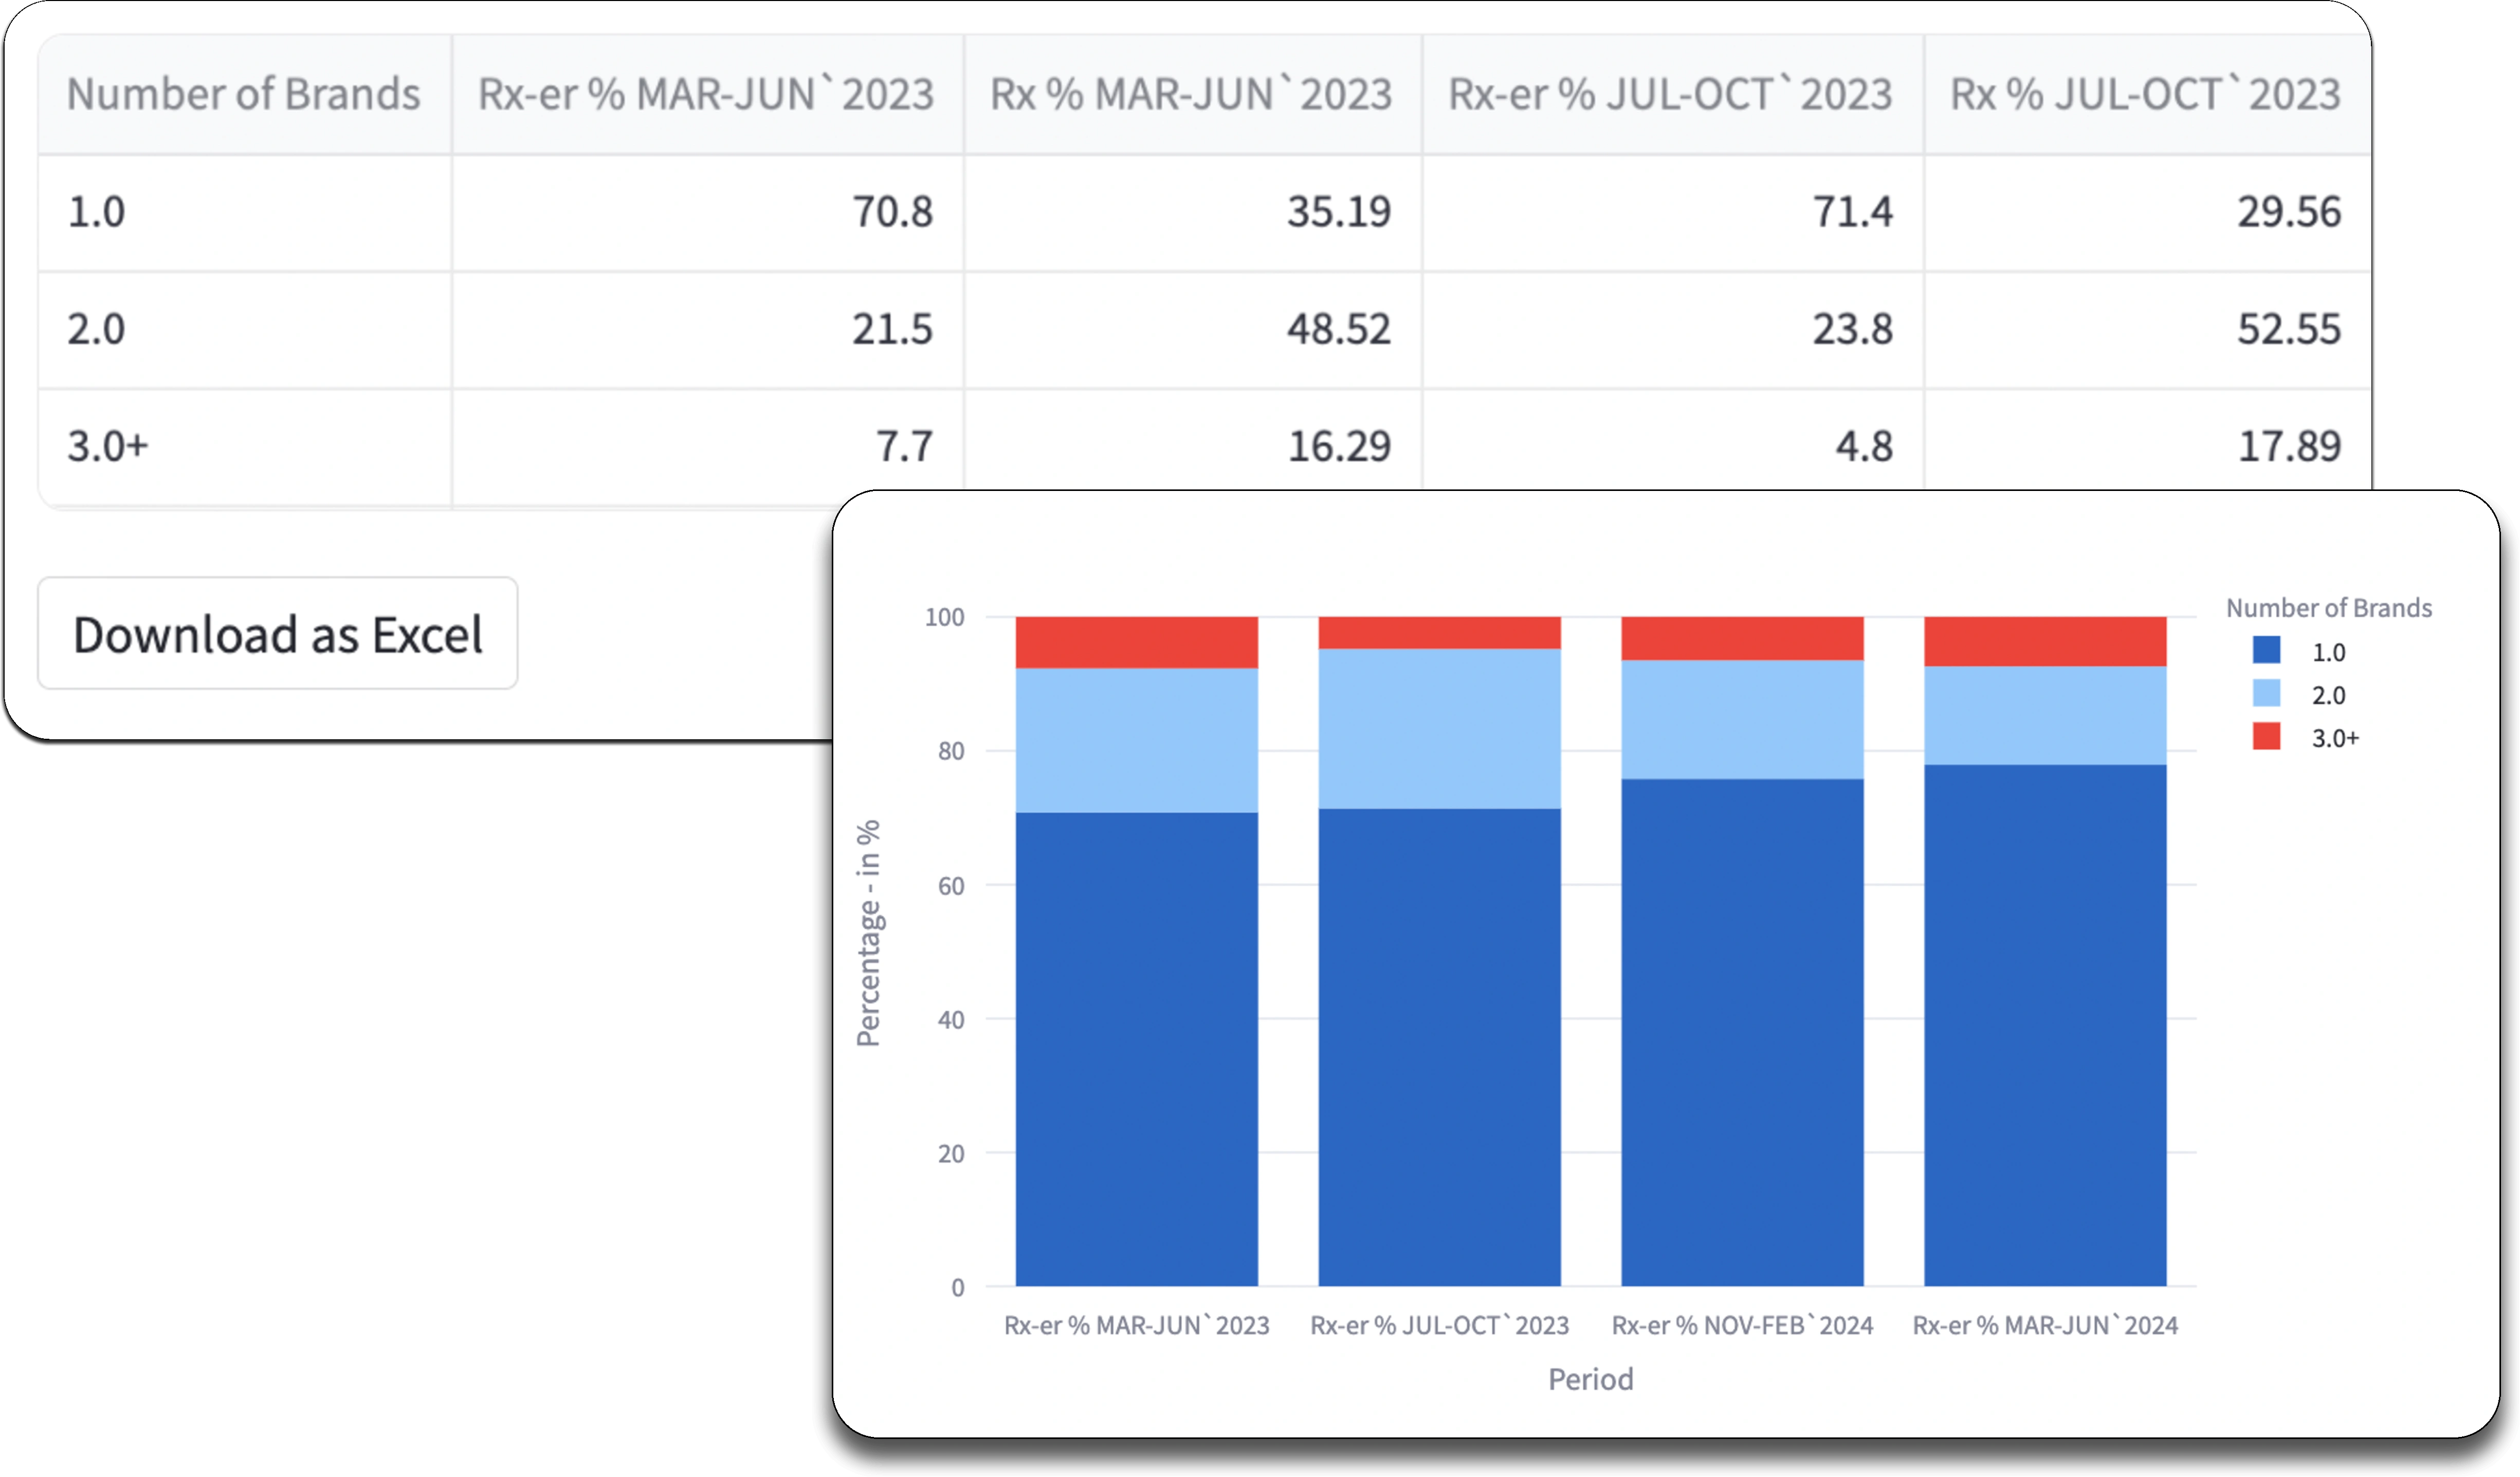
Use measures such as prescriber base to evalaute what percentage of the HCP universe serves as your prescribers and per-capita Rx contribution to measure the rate of prescriptions generated per prescriber.

Determine if your covered HCPs are multi-product prescribers and whether their contribution meets or exceeds industry benchmarks and peer performance.

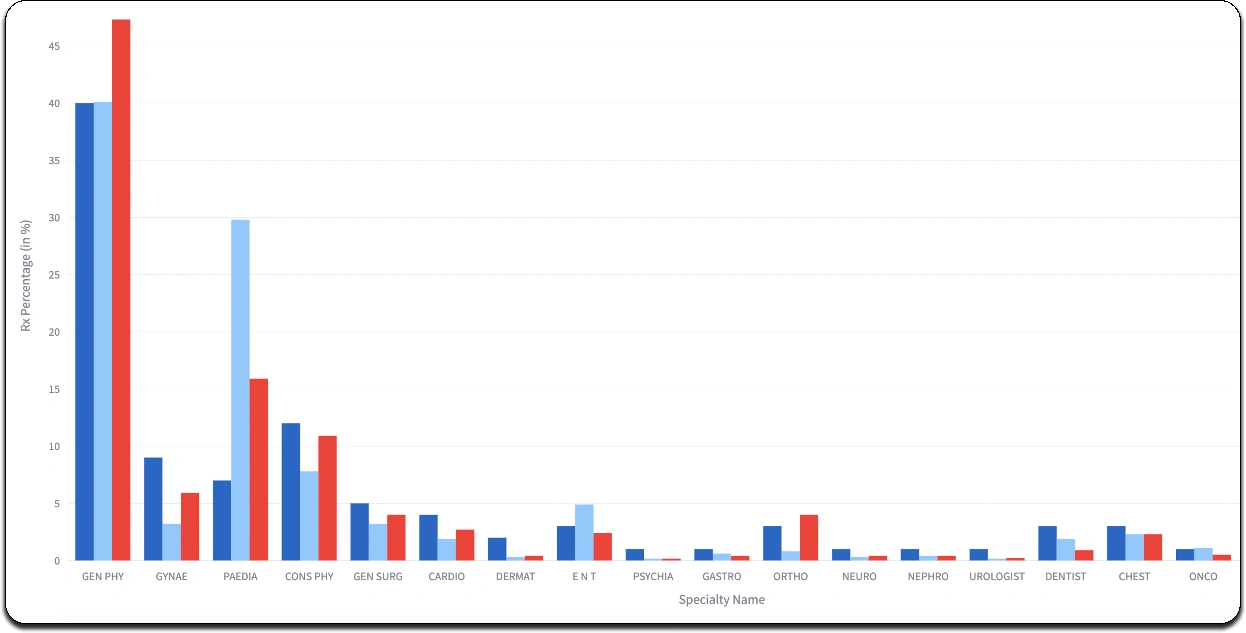
Assess which specialty segments are generating the most prescriptions for your brands, corporate or your interested molecules and therapies.

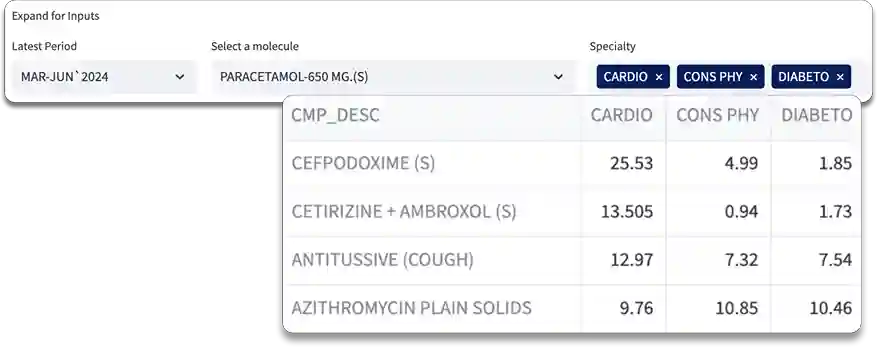
Gain valuable insights into which molecules or brands are getting co-prescribed alongside your targeted molecules and brands across various specialties.
rx standing coverage & per-capita prescriber loyalty illustration specialty co-rx
Peer Performance

Compare performances vs peers

Select relevant competitors, define your custom market to track benchmarks across relevant parameters.
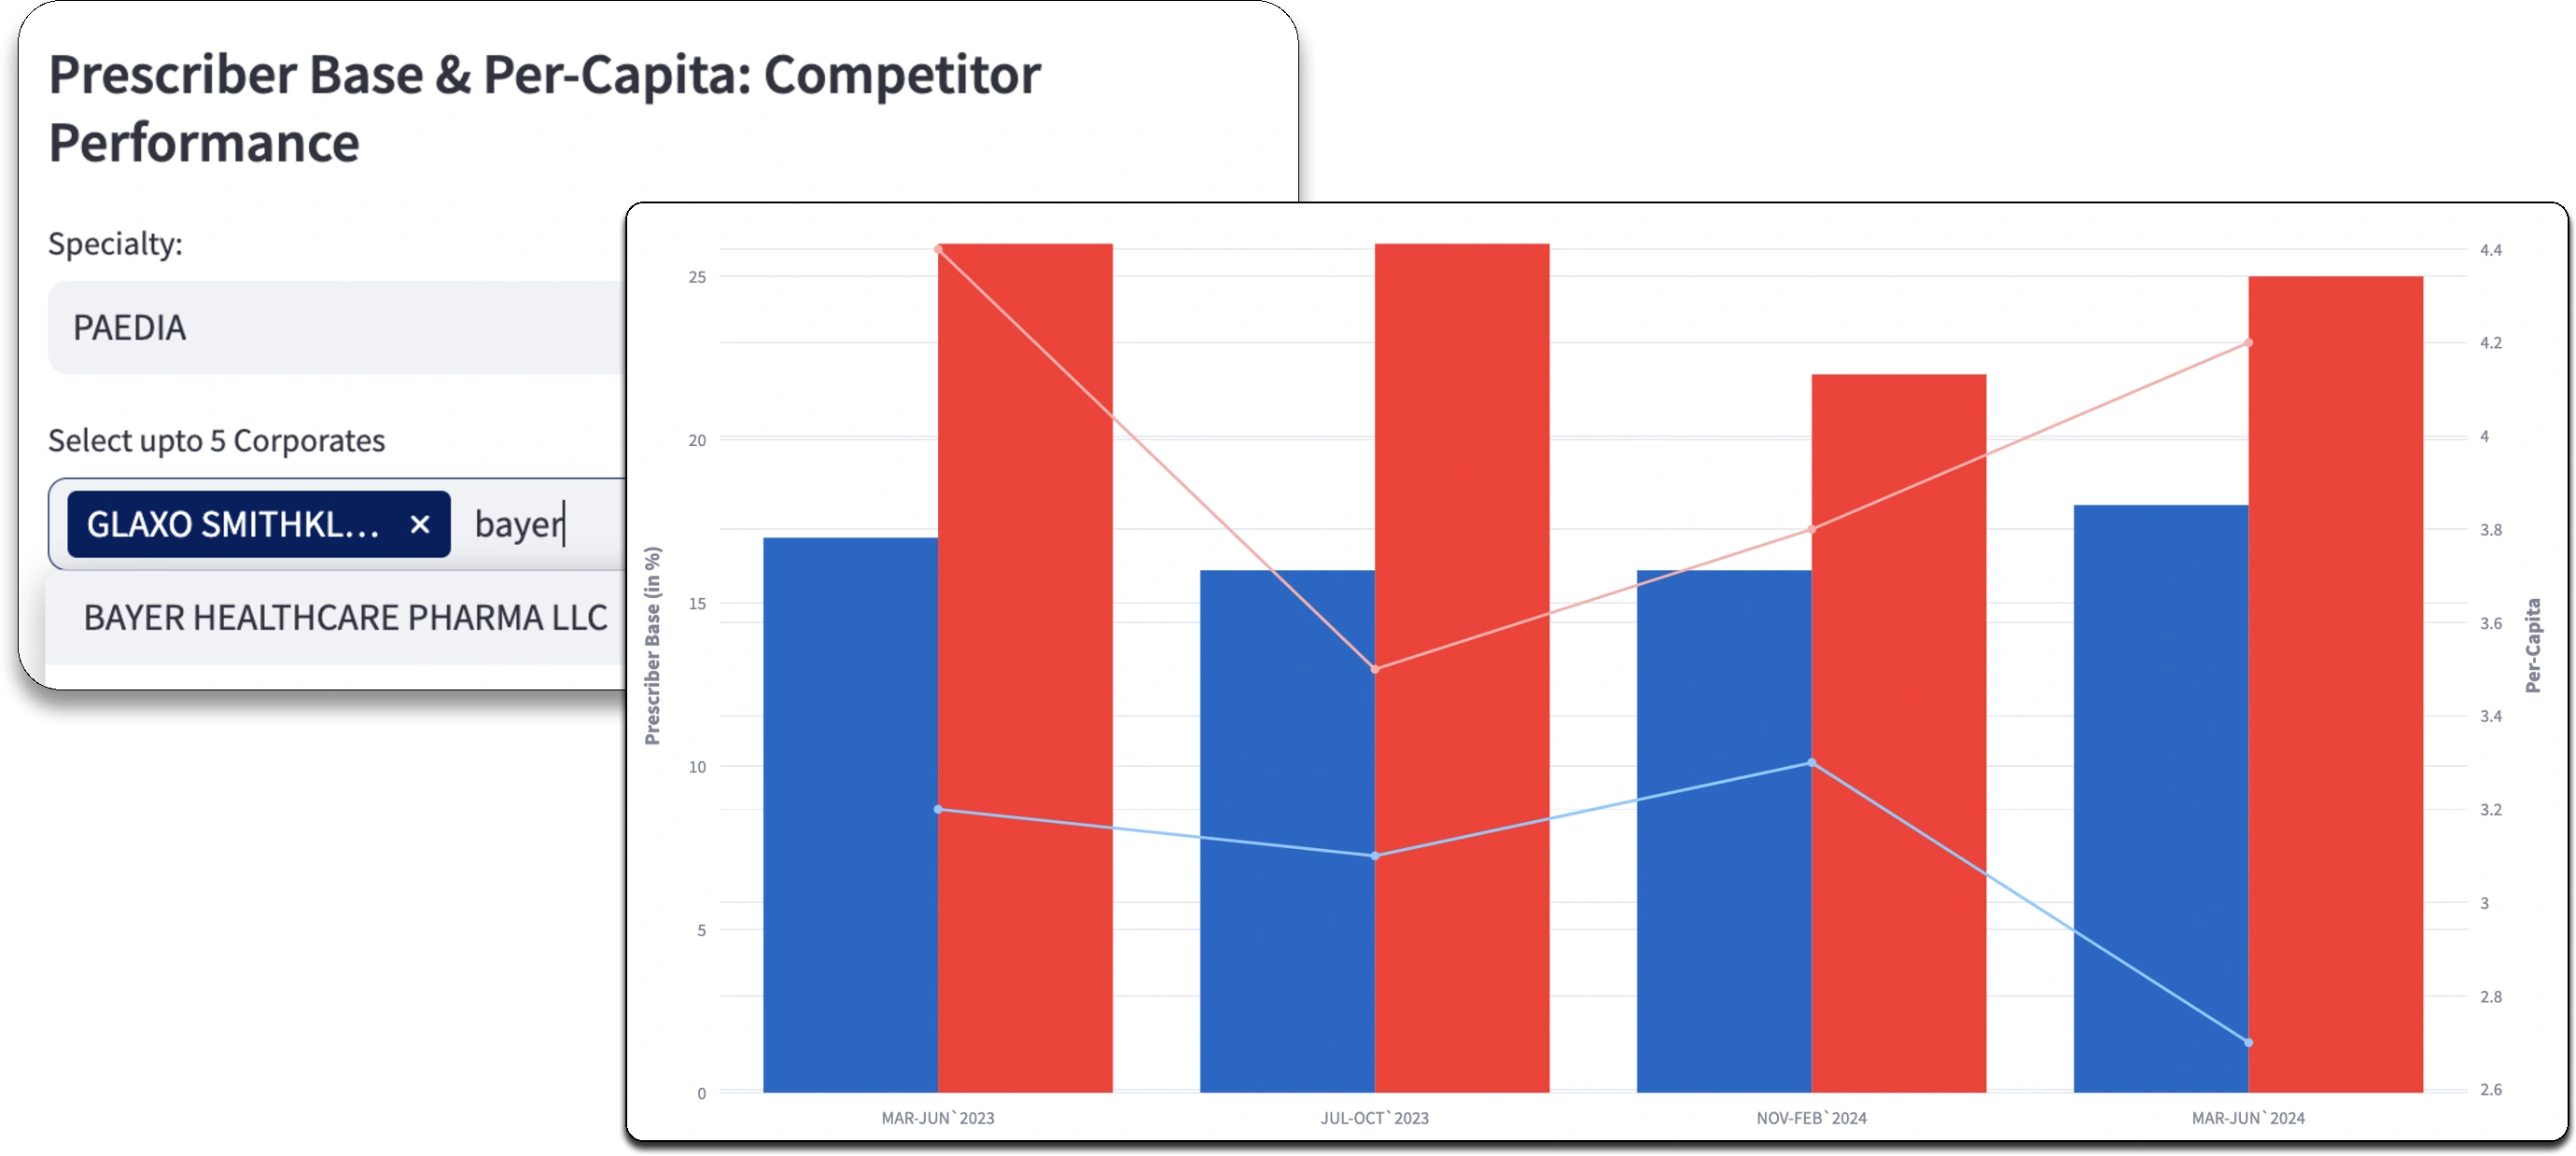
Peer Performance

Examine micro-level performance

Get a top-level view of your corporate & business-unit performance to identify strengths, weaknesses, opportunities & threats. Do a further deep-dive analysis using our platform to evaluate therapy, molecule or brand performance.
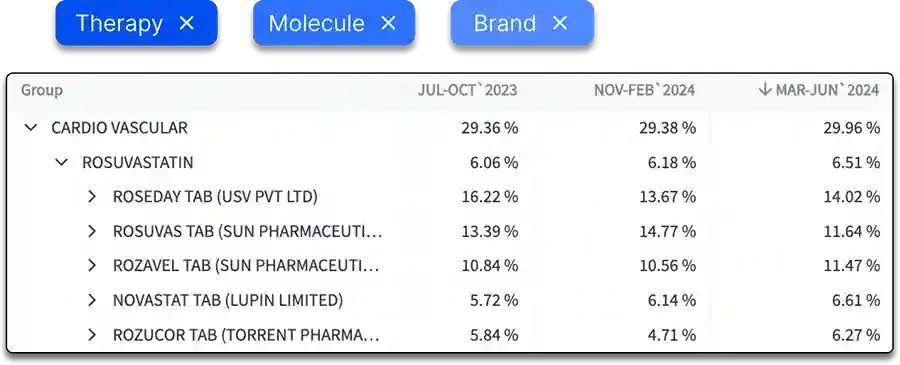
pivot view
exporting spreadsheets in excel feature exporting spreadsheets in excel feature

Generate customized Excel reports
as per your key dimensions

Generate customized Excel reports as per your key dimensions

Subscribers have the flexibility to define regions, specialties, therapies, and beyond, enabling them to create interactive charts and download reports in the formats they need.

Contact us to know more

Discover our product's capablities and uncover how it can benefit you.